Sun Belt vs. Midwest: Where Smart Investors Are Buying in 2026
Sun Belt markets that boomed during the pandemic are now posting double-digit price drops. Meanwhile, the Midwest is seeing its strongest rent growth in decades. Here's where the data says to invest.
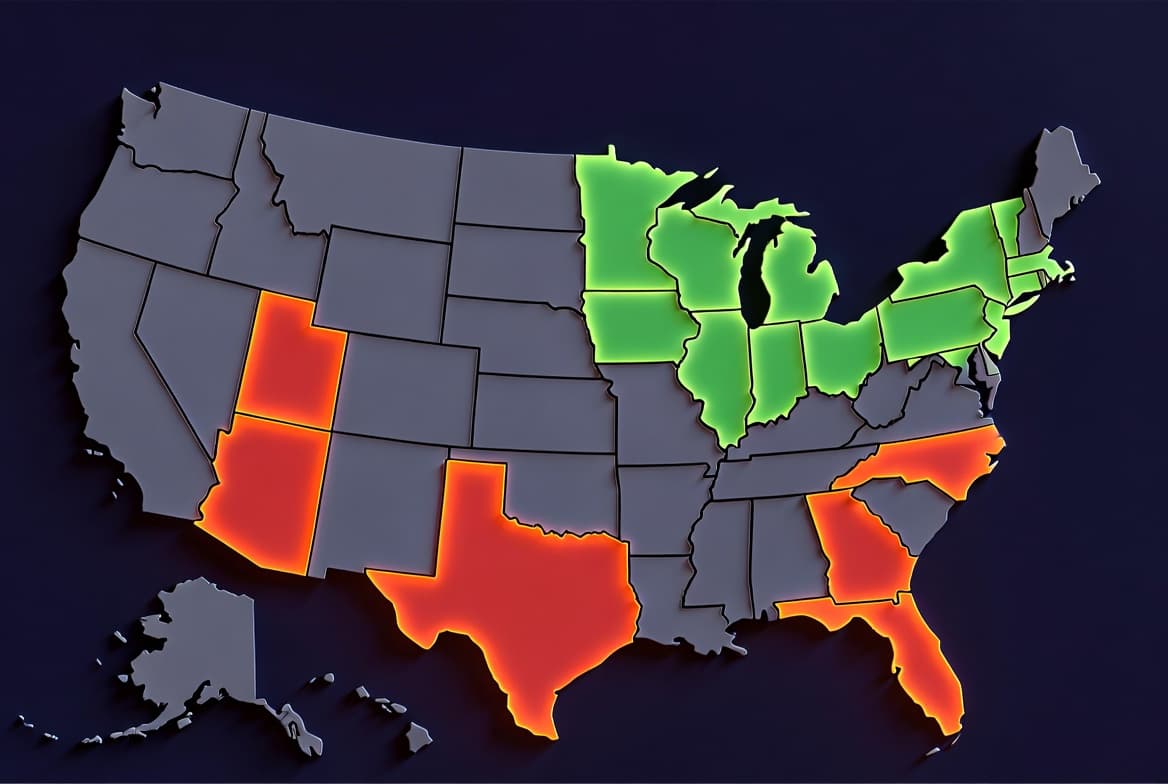
For the better part of a decade, the playbook was simple: buy in the Sun Belt. Florida, Texas, Arizona, Georgia — that's where the population growth was, where the jobs were moving, and where the appreciation seemed unstoppable.
That playbook is broken.
In 2026, the markets that made investors rich during the pandemic are handing back those gains — and then some. Meanwhile, a region most investors have been ignoring is quietly posting the strongest fundamentals in the country.
The Sun Belt Correction
Let's start with what's happening in the markets everyone was piling into.
Florida is leading the downturn. Several counties in Western Florida are down 15-25% from their 2022 peaks:
| County | Price Decline from Peak |
|---|---|
| Charlotte County | -22.4% |
| Lee County | -16.5% |
| Sarasota County | -16.4% |
| Manatee County | -13.4% |
Short sales are back. Florida currently has over 1,400 active short sale listings on major platforms, with some properties selling at six-figure discounts from what the owner paid just two years ago. The state ranks #1 nationally in foreclosure filings.
It's not just Florida. Austin rents have dropped over 20% since 2022 — a brutal correction for investors who underwrote deals at peak rents. Atlanta is seeing properties that sold for $330,000 in 2023 now listed under $200,000. Phoenix, Nashville, Charlotte, Dallas, San Antonio — all posting meaningful declines.
The pattern is clear: markets that saw the sharpest pandemic appreciation are now giving back the most.
Why It Happened
The Sun Belt correction isn't random. Three forces are converging:
1. Overbuilding caught up. Builders flooded Sun Belt markets with new construction during the boom. That supply is now hitting the market just as demand cools. More supply + less demand = falling prices.
2. Insurance and costs exploded. Florida property insurance has doubled or tripled for many owners. HOA fees, property taxes, and maintenance costs in Sun Belt markets have risen sharply, eating into cash flow and making some properties un-rentable at a profit.
3. Remote work migration reversed. The pandemic-era migration to Sun Belt cities has slowed dramatically. Domestic migration into Southern states has fallen to one of its weakest levels in decades.
The Midwest Surprise
While Sun Belt investors are watching their equity evaporate, something unexpected is happening in the Midwest.
Rent growth is surging. Ten of the top fifteen rent-growth markets in the US are now in the Midwest and Northeast:
| City | Rent Growth Since 2022 |
|---|---|
| Chicago | +13.6% |
| Madison | 10%+ |
| Buffalo | 10%+ |
| Milwaukee | Top 5 nationally |
| Rochester | Top 6 nationally |
| Hartford | +12.2% |
Chicago rents have climbed from roughly $1,542 to $1,751 per month since 2022. The city posted its strongest domestic migration performance in approximately 35 years during 2025.
Migration is shifting. The Midwest recorded its first positive domestic migration year in nearly forty years. The gap between Southern and Midwest migration has narrowed to its smallest level in more than thirty years.
This is a structural shift, not a blip.
Running the Numbers: Midwest vs. Sun Belt
Let's compare two hypothetical deals — one in a correcting Sun Belt market and one in a growing Midwest market.
Sun Belt Deal: Orlando, FL
| Item | Amount |
|---|---|
| Purchase Price | $280,000 |
| Down Payment (25%) | $70,000 |
| Closing + Repairs | $12,000 |
| Total Cash Invested | $82,000 |
| Monthly Rent | $1,800 |
| Insurance | $350/mo |
| Property Tax | $280/mo |
| HOA | $150/mo |
| Vacancy (8%) | $144/mo |
| Management (10%) | $180/mo |
| Mortgage (7%) | $1,397/mo |
| Monthly Cash Flow | -$701 |
| Cash on Cash Return | -10.3% |
That's negative cash flow — and rents are still falling in Orlando.
Midwest Deal: Milwaukee, WI
| Item | Amount |
|---|---|
| Purchase Price | $185,000 |
| Down Payment (25%) | $46,250 |
| Closing + Repairs | $8,000 |
| Total Cash Invested | $54,250 |
| Monthly Rent | $1,550 |
| Insurance | $120/mo |
| Property Tax | $220/mo |
| Vacancy (5%) | $78/mo |
| Management (8%) | $124/mo |
| Mortgage (7%) | $922/mo |
| Monthly Cash Flow | $86 |
| Cash on Cash Return | 1.9% |
The Milwaukee deal isn't a home run, but it's cash-flow positive on day one — and rents are growing 10%+ annually. In twelve months, that CoC return could be north of 5%.
More importantly, you're investing $54,000 instead of $82,000. That leftover $28,000 could fund a second property.
What Smart Investors Are Doing
The data points to a clear strategy shift:
1. Follow the rent growth, not the hype. Appreciation is speculation. Cash flow is math. Markets with strong rent growth provide a margin of safety that appreciating-but-overpriced markets don't.
2. Prioritize low insurance and operating costs. A Sun Belt property might look cheap on the sticker price, but when insurance is $4,000/year and climbing, your real cost basis is much higher. Midwest insurance and property tax costs are often 40-60% lower.
3. Buy where supply is constrained. Midwest cities didn't overbuild during the pandemic boom. Housing starts were modest, and inventory remains tight. That's the foundation for sustained rent growth.
4. Run every deal through a calculator. Gut feeling doesn't work in a shifting market. You need to model cash flow, CoC return, DSCR, and cap rate for every property — especially when comparing markets you're less familiar with.
The Bottom Line
The Sun Belt isn't dead for investors. There will be screaming deals as distressed sellers capitulate over the next 12-18 months. But those deals require careful analysis — you need to know exactly what a property is worth today, not what someone paid for it in 2022.
The Midwest, meanwhile, offers something the Sun Belt hasn't provided in years: growing rents, affordable entry prices, and positive cash flow from day one. For investors who prioritize cash flow over speculation, that's a hard combination to beat.
Analyze Any Market Instantly
Whether you're evaluating a Sun Belt bargain or a Midwest cash-flow play, Pacific Rentals Pro gives you a full property analysis in seconds. Enter any US address and get cash-on-cash return, cap rate, DSCR, cash flow projections, and more — for free.
Compare markets side by side and find the deal that actually makes money.
Try the free rental property calculator →
Keep Learning
- How to Calculate Cash on Cash Return — the single best metric for comparing deals across markets.
- LTR vs STR: Which Strategy Wins? — a Midwest LTR vs a Sun Belt STR might surprise you.
- Understanding Cap Rates for Investors — why cap rate alone can mislead you in a shifting market.