Property Calculator
Free rental property calculator for investors
Enter any U.S. address and get a complete cash flow analysis in seconds — cap rate, cash-on-cash return, DSCR and NOI, for both long-term and short-term scenarios. Then see whether the market itself is expensive, not just the deal. Real data from 140M+ properties.
Try the Calculator FreeLong-Term Rental (LTR)
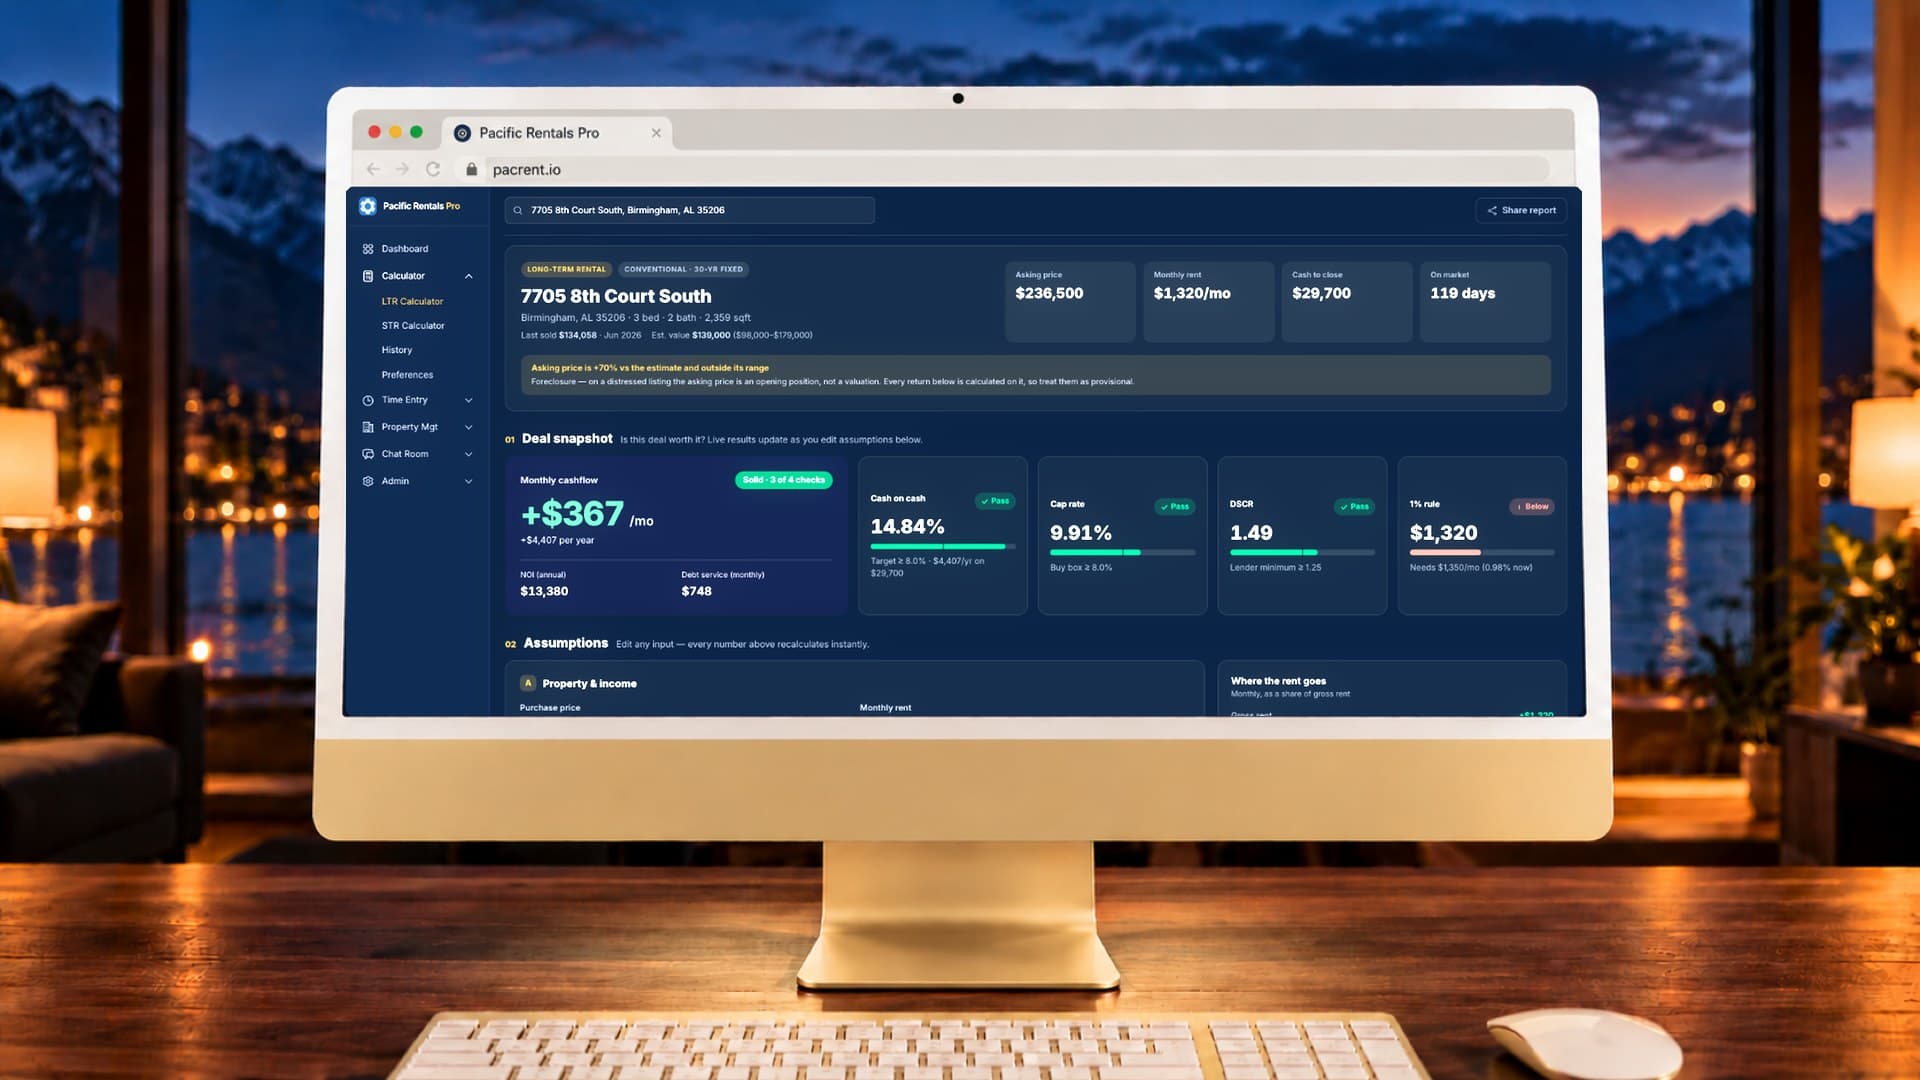
Enter an address and get the whole picture in seconds — 1% rule, NOI, cap rate, DSCR and cash-on-cash, with every financing and expense assumption yours to change.
- Market affordability — price to income against the county's own long-run average, so you can see whether the market is expensive, not just whether the deal is
- Price history and rental demand for that specific address, not the zip code
- Cash needed to close, down payment and closing costs included
- Share any analysis as a link — no account needed to read it
Short-Term Rental (STR)
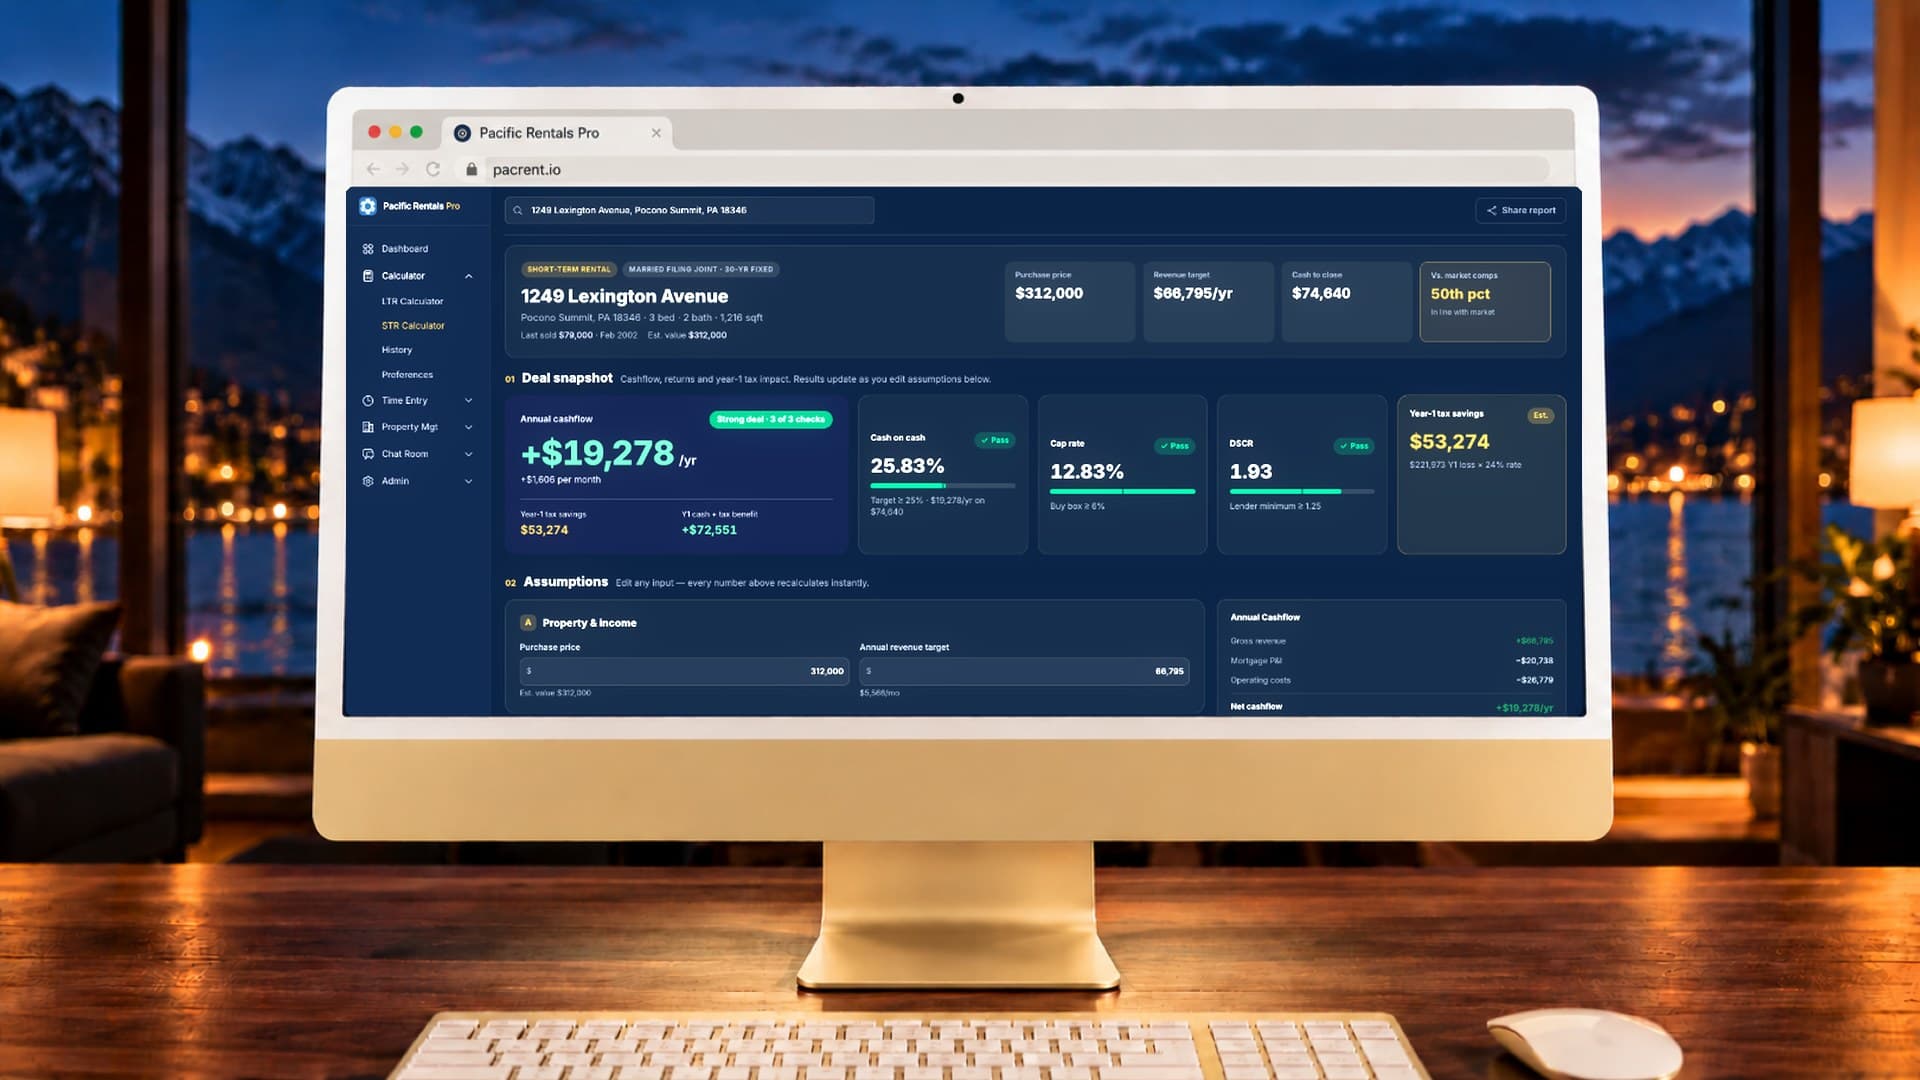
Model a short-term rental on real Airbnb and VRBO comparables — nightly rate, occupancy and revenue per available night, against the operating costs that actually apply.
- Market comparables — what similar rentals nearby charge, how full they run, and what they take
- Tax position — first-year depreciation losses, and your federal tax before and after them
- The same affordability and price history as the LTR side
- Compare both strategies on one property before you commit to either
Every metric, and the market context behind it
1% Rule
Monthly rent divided by purchase price.
A thirty-second screen before you model anything. Above 1% is strong; most markets today sit well below it.
Cap Rate
Net operating income divided by property value.
Lets you compare properties at different prices on the same footing. Long-term rentals typically run 6–8%.
Cash-on-Cash
Annual cash flow divided by the cash you actually put in.
The return on your money rather than on the property. 8–14% is a common target.
NOI
Rent minus operating costs, before the mortgage.
The figure lenders and buyers compare, because it is the same whoever owns the loan.
DSCR
Net operating income divided by debt service.
Whether the rent covers the loan. Lenders generally want 1.25 or better.
Tax Savings
First-year depreciation and the federal tax it offsets.
Often the number that decides a short-term rental, and the one spreadsheets leave out.
Market Affordability
Price to income against the county's own long-run average.
4.9x on its own means nothing. 4.9x against a 3.9x thirty-year average means the market is stretched.
Rental Demand
How long comparable units sit before they let.
Under 10 days is high demand, over 30 is slow. It is the sanity check on any rent estimate.
Price History
What the property last sold for, and when.
Shows you what the current asking price is really built on, and how the county index moved since.
140M+
Properties in database
2,000+
Active investors
$1.2B+
Portfolio value analyzed
98%
Analysis accuracy
“I analyzed 40 properties in a weekend and found two deals that penciled out. Closed on both within a month.”
Marcus Chen
12 properties, Austin TX
“The REP time tracker alone saved me $14k on my taxes last year. The expense tracking and receipt capture is the cherry on top.”
Sarah Mitchell
8 properties, Tampa FL
“Finally a tool built by investors, for investors. The LTR vs STR comparison feature is something I couldn't find anywhere else.”
James Okoye
22 properties, Nashville TN
How the rental property calculator works
What is a rental property calculator?
A rental property calculator is a tool that estimates cash flow, cap rate, cash-on-cash return, and total ROI for an investment property. Pacific Rentals Pro pulls real rent estimates, tax records, and comparable data so you get accurate projections — not guesswork.
How do you calculate cash flow on a rental property?
Cash flow equals gross rental income minus all operating expenses (taxes, insurance, vacancy, management, maintenance) and mortgage payments. Our cash flow calculator breaks down every line item so you can see exactly where the money goes.
What is a good cap rate for a rental property?
A good cap rate depends on the market and property type, but most investors target 6–8% for long-term rentals. Cap rate is net operating income divided by property value. Our calculator computes it automatically and shows the typical range beside it, so you can see where a property falls rather than guessing.
How do I know if a market is overpriced?
Price to income is the oldest answer, and it only means something next to the same place's own history. Our affordability indicator divides the county's median home price by its median household income, then shows today's ratio against the long-run average — often thirty years or more. A market at 4.9x against a 3.9x average is stretched. The same 4.9x somewhere that has averaged 5.2x is not.
Can I compare long-term vs short-term rental returns?
Yes. Pacific Rentals Pro includes separate LTR and STR calculators. Compare cash flow, cap rate, occupancy-adjusted revenue, and total ROI side by side for any property to decide which strategy produces better returns.
Is the rental property calculator really free?
Yes. The Starter plan includes LTR and STR analysis at no cost, up to 10 property searches a day. Pro is $19/month for unlimited analyses, AI document scanning, tenant management, and digital lease signing.
Stop guessing. Start analyzing.
Join thousands of investors using Pacific Rentals Pro to calculate cash flow, cap rates, and ROI on deals that actually pencil out.
Get Started Free