Foreclosures Are Rising. I Bought Two in 2008 — and This Is Not 2008.
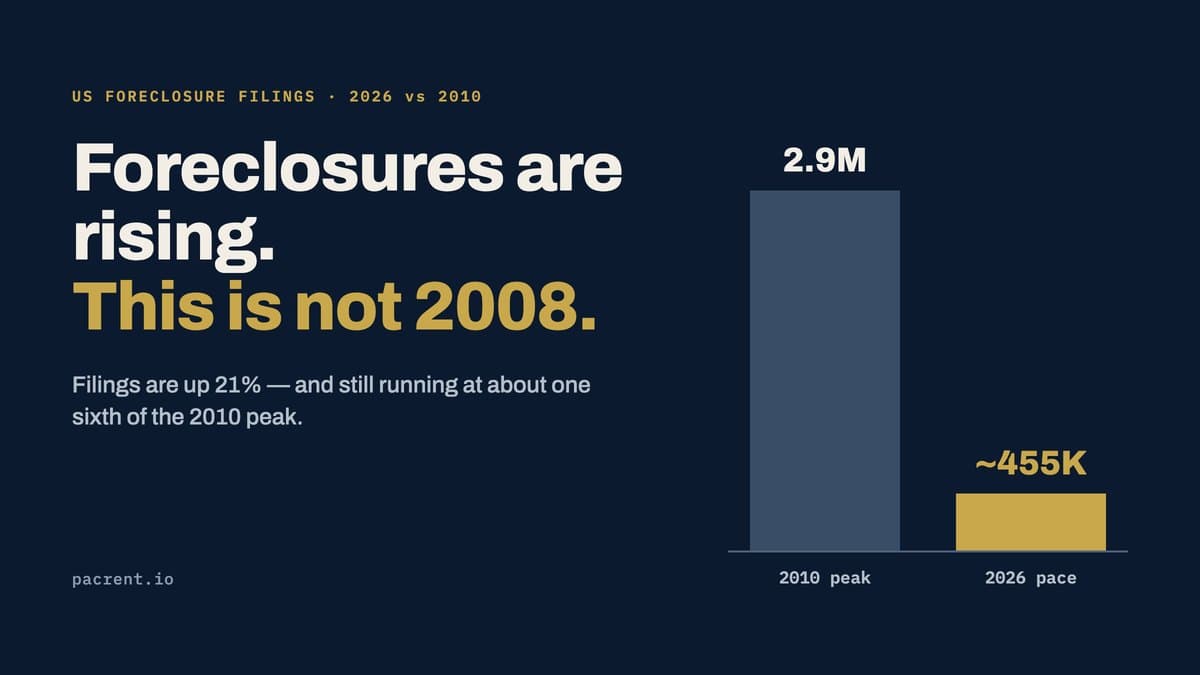
Foreclosure filings are up — and still running at about one sixth of the 2008 peak. The real numbers, the history, and where the opportunity is.
Every few weeks a number goes round that is supposed to mean the crash is here. This month it is foreclosures, "up 40%."
The number is roughly real. Almost everything attached to it is not.
I have a particular reason to care how this gets reported. I bought two foreclosures during the last crisis. I watched that market from the inside, as a buyer, while people with far more experience than me insisted every month that the bottom was still ahead. My only regret from that period is that I did not buy more.
So when I see "foreclosures up 40%" I do not reach for the panic. I reach for the actual release.
What the latest data actually says
The most recent monthly figures from ATTOM, the firm that compiles the national foreclosure dataset, cover August 2026:
| Measure | Count | vs last month | vs last year |
|---|---|---|---|
| Properties with filings | 40,277 | +1% | +13% |
| Foreclosure starts | 25,894 | −3% | +7% |
| Completed foreclosures (REO) | 5,794 | +22% | +42% |
There is your 40%. It is completed repossessions, year over year — not total foreclosures, and not month over month. In the same release, foreclosure starts fell 3%.
Starts are the number that tells you whether new distress is entering the system. Completions tell you what is leaving it, and what is leaving it now was filed a year or more ago. Reporting the exit queue as if it were the entrance is how a backlog becomes a crisis in a headline.
It is also 5,794 homes. The United States has roughly 145 million housing units. One filing of any kind per 3,569 of them.
The history worth remembering
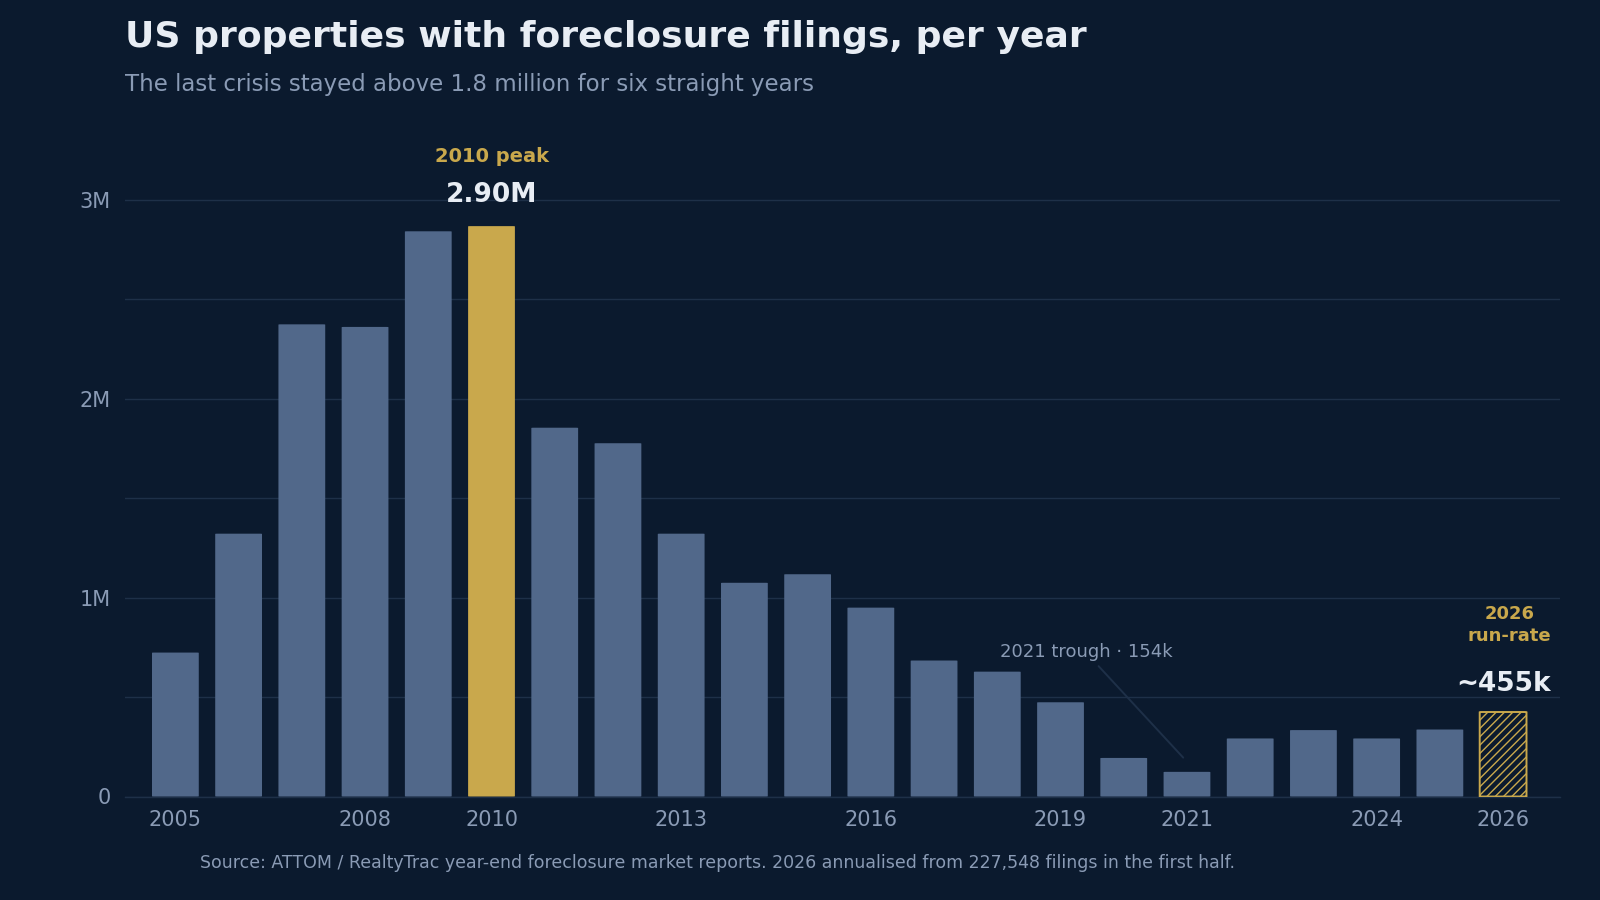
Here is what an actual foreclosure crisis looks like, measured the same way, by the same source.
| Year | Properties with filings |
|---|---|
| 2005 | 754,000 |
| 2007 | 2,405,000 |
| 2008 | 2,392,000 |
| 2009 | 2,873,000 |
| 2010 | 2,899,000 — peak |
| 2011 | 1,885,000 |
| 2012 | 1,807,000 |
| 2019 | 504,000 |
| 2021 | 154,000 — trough |
| 2025 | 367,460 |
| 2026 | ~455,000 annualised |
Read the top of that table slowly. Nearly 2.9 million properties in a single year, about 2.23% of every housing unit in the country. And it was not one bad year. Filings ran above 1.8 million for six consecutive years, from 2007 through 2012. The pain did not peak in 2008; it peaked two years later and took until roughly 2016 to normalise.
2025 came in at 367,460 — down 87% from that peak. The first half of 2026 ran 227,548, which annualises to about 455,000. Call it one sixth of 2010.
That is the perspective the percentage hides. A 21% rise off a historic low is a different event from a 21% rise off 2.4 million.
Why this cannot cascade the way 2008 did
Perspective is not the same as complacency, so here is the mechanism rather than the mood.
| 2008–2010 | Now | |
|---|---|---|
| Mortgages underwater | 24–26% at peak | ~2–3% |
| Mortgage delinquency | ~9.9% (2010) | 4.37% (Q2 2026) |
| Unemployment | 10.0% (Oct 2009) | 4.2% (Sept 2026) |
The first row is the one that matters, and it is not a statistic so much as a description of human behaviour.
An owner who cannot pay but has equity sells the house. They may lose the home, but they walk away with money, and the sale is an ordinary listing that never enters the foreclosure data. An owner who cannot pay and is underwater has nothing to sell — the house is worth less than the debt — so they stop paying and hand back the keys. In 2009, more than 11 million households were in that second position. Today it is closer to one.
That is why 2008 cascaded. Negative equity turned every job loss into a foreclosure, and every foreclosure into a comp that pushed the next neighbour underwater. The loop ran for four years. Today that loop has almost nothing to feed on.
There is a second, quieter reason completions are up: ATTOM reports average foreclosure timelines have fallen to 563 days, the lowest since 2013. Cases are clearing faster. A faster queue produces more exits per month without any increase in arrivals — which is precisely what "starts down 3%, completions up 42%" describes.
The honest caveat: unemployment is softening. It ticked to 4.2% in September on a weak payroll print, and delinquency is up 44 basis points year over year. Those are the numbers to watch, because the chain runs job loss → delinquency → starts → completions. Today it is the tail of that chain moving, not the head. If starts begin climbing while unemployment rises, that is a different story and I will write it.
For more on how this cycle differs structurally, see the 2026 market versus 2008 and what is happening in the mortgage industry.
What "foreclosure" actually means, stage by stage
If you are going to buy in this space — or help someone in it — you need to know what the word describes. It is not an event. It is a process with doors that close in order. I will use Colorado, because it is where I invest and because it works differently from most states.
Colorado is a non-judicial, Public Trustee state. Foreclosures run through a county official rather than a court or a private trustee, which makes the process faster and more procedural than in judicial states.
- Missed payments. Late fees, calls from the servicer. Catching up is straightforward here.
- Early delinquency, roughly 30–120 days. Breach letters. The servicer must make loss-mitigation options available: forbearance, a repayment plan, a modification.
- The 120-day federal rule. Under CFPB servicing rules (12 C.F.R. § 1024.41) a servicer generally cannot begin foreclosure until the borrower is more than 120 days delinquent. Everything above happens before anything becomes public.
- Notice of Election and Demand. The lender records the NED with the county Public Trustee. This is the first public step — and the first moment the property appears on any investor's list.
- Publication and the Rule 120 hearing. The sale is advertised and a court authorises it, confirming the default is real and the borrower is not on active military duty.
- The Public Trustee sale. The auction happens no earlier than 110 days after the NED is recorded, typically in a 110 to 125 day window.
- REO. If nobody bids enough, the property reverts to the lender.
Two Colorado details that generic articles routinely get wrong:
The cure deadline is not the day before the sale. The owner must file a written notice of intent to cure at least 15 calendar days before the sale date; the money is then due by noon the day before. Miss the notice and the right to cure is gone even with the cash in hand.
There is no homeowner redemption after the sale. Colorado eliminated it effective 1 January 2008, replacing it with the longer pre-sale cure window. Only junior lienholders may redeem, within eight business days. Any article telling a Colorado homeowner they can buy the house back after the auction is describing a different state.
Where the opportunity is — and where it isn't
Foreclosure is a bad outcome for a household. It is also, unavoidably, a transaction, and transactions have a buyer. Both things are true, and pretending otherwise helps nobody.
But I want to be careful about my own regret, because "I wish I'd bought more in 2009" is not advice. It is hindsight about a specific set of conditions: prices had fallen by a third, inventory was enormous, and almost nobody would lend. None of those three things is true in 2026. Anyone selling you the 2008 playbook today is selling you a story about a market that does not exist.
What is actually available now is narrower and more specific:
- Pre-foreclosure, before the NED. This is the stage that matters most and gets the least attention. An owner with equity who sells here keeps that equity; the same owner at auction loses it. With most distressed owners now holding equity, this is where a fair cash offer is genuinely the better outcome for them — not a favour you are doing, but not predation either.
- The auction. Cash, sight-unseen, title risk, occupants in place, and you are bidding against professionals who do this weekly. The discounts are real and so are the ways to lose money.
- REO. Slower, financeable, inspectable, and correspondingly thinner margins.
Before any of them, underwrite the deal on its own numbers. A foreclosure is not a discount; it is a property with a particular history and a particular set of risks priced into it. Run the numbers the same way you would on any other purchase — if it does not work as a rental at today's rates, the word "foreclosure" does not make it work.
And if you are reading this because it is your house: the options in step two above are real, they are free to explore, and they close in order. HUD-approved housing counsellors cost nothing (hud.gov/findacounselor), the CFPB publishes plain-English guides, and a foreclosure-defence attorney in your state will tell you more in an hour than any article can. Earlier is better at every single stage.
The number to actually watch
Not completions. Starts — and the unemployment rate that feeds them.
Right now starts are down month over month, equity is at record levels, and the thing driving the scary headline is a backlog clearing faster than it used to. That can change. It has not changed yet.
The last cycle taught me that the people who did well were the ones who knew what the numbers meant while everyone else was reacting to what they sounded like. That is still the whole job.
This article is general information, not legal, tax or investment advice. Foreclosure law varies substantially by state, and the Colorado process described here will not match your state's. Consult an attorney licensed where the property is before acting.